
MORI
An embedded Dev/QA team and a bespoke 'Sleep Club' subscription engine for sustainable babywear.
Read Case Study
Case Study
MORI's merchandising team spent 95% of every buying cycle assembling data and 5% deciding what to buy. The assembly now happens overnight, on its own.

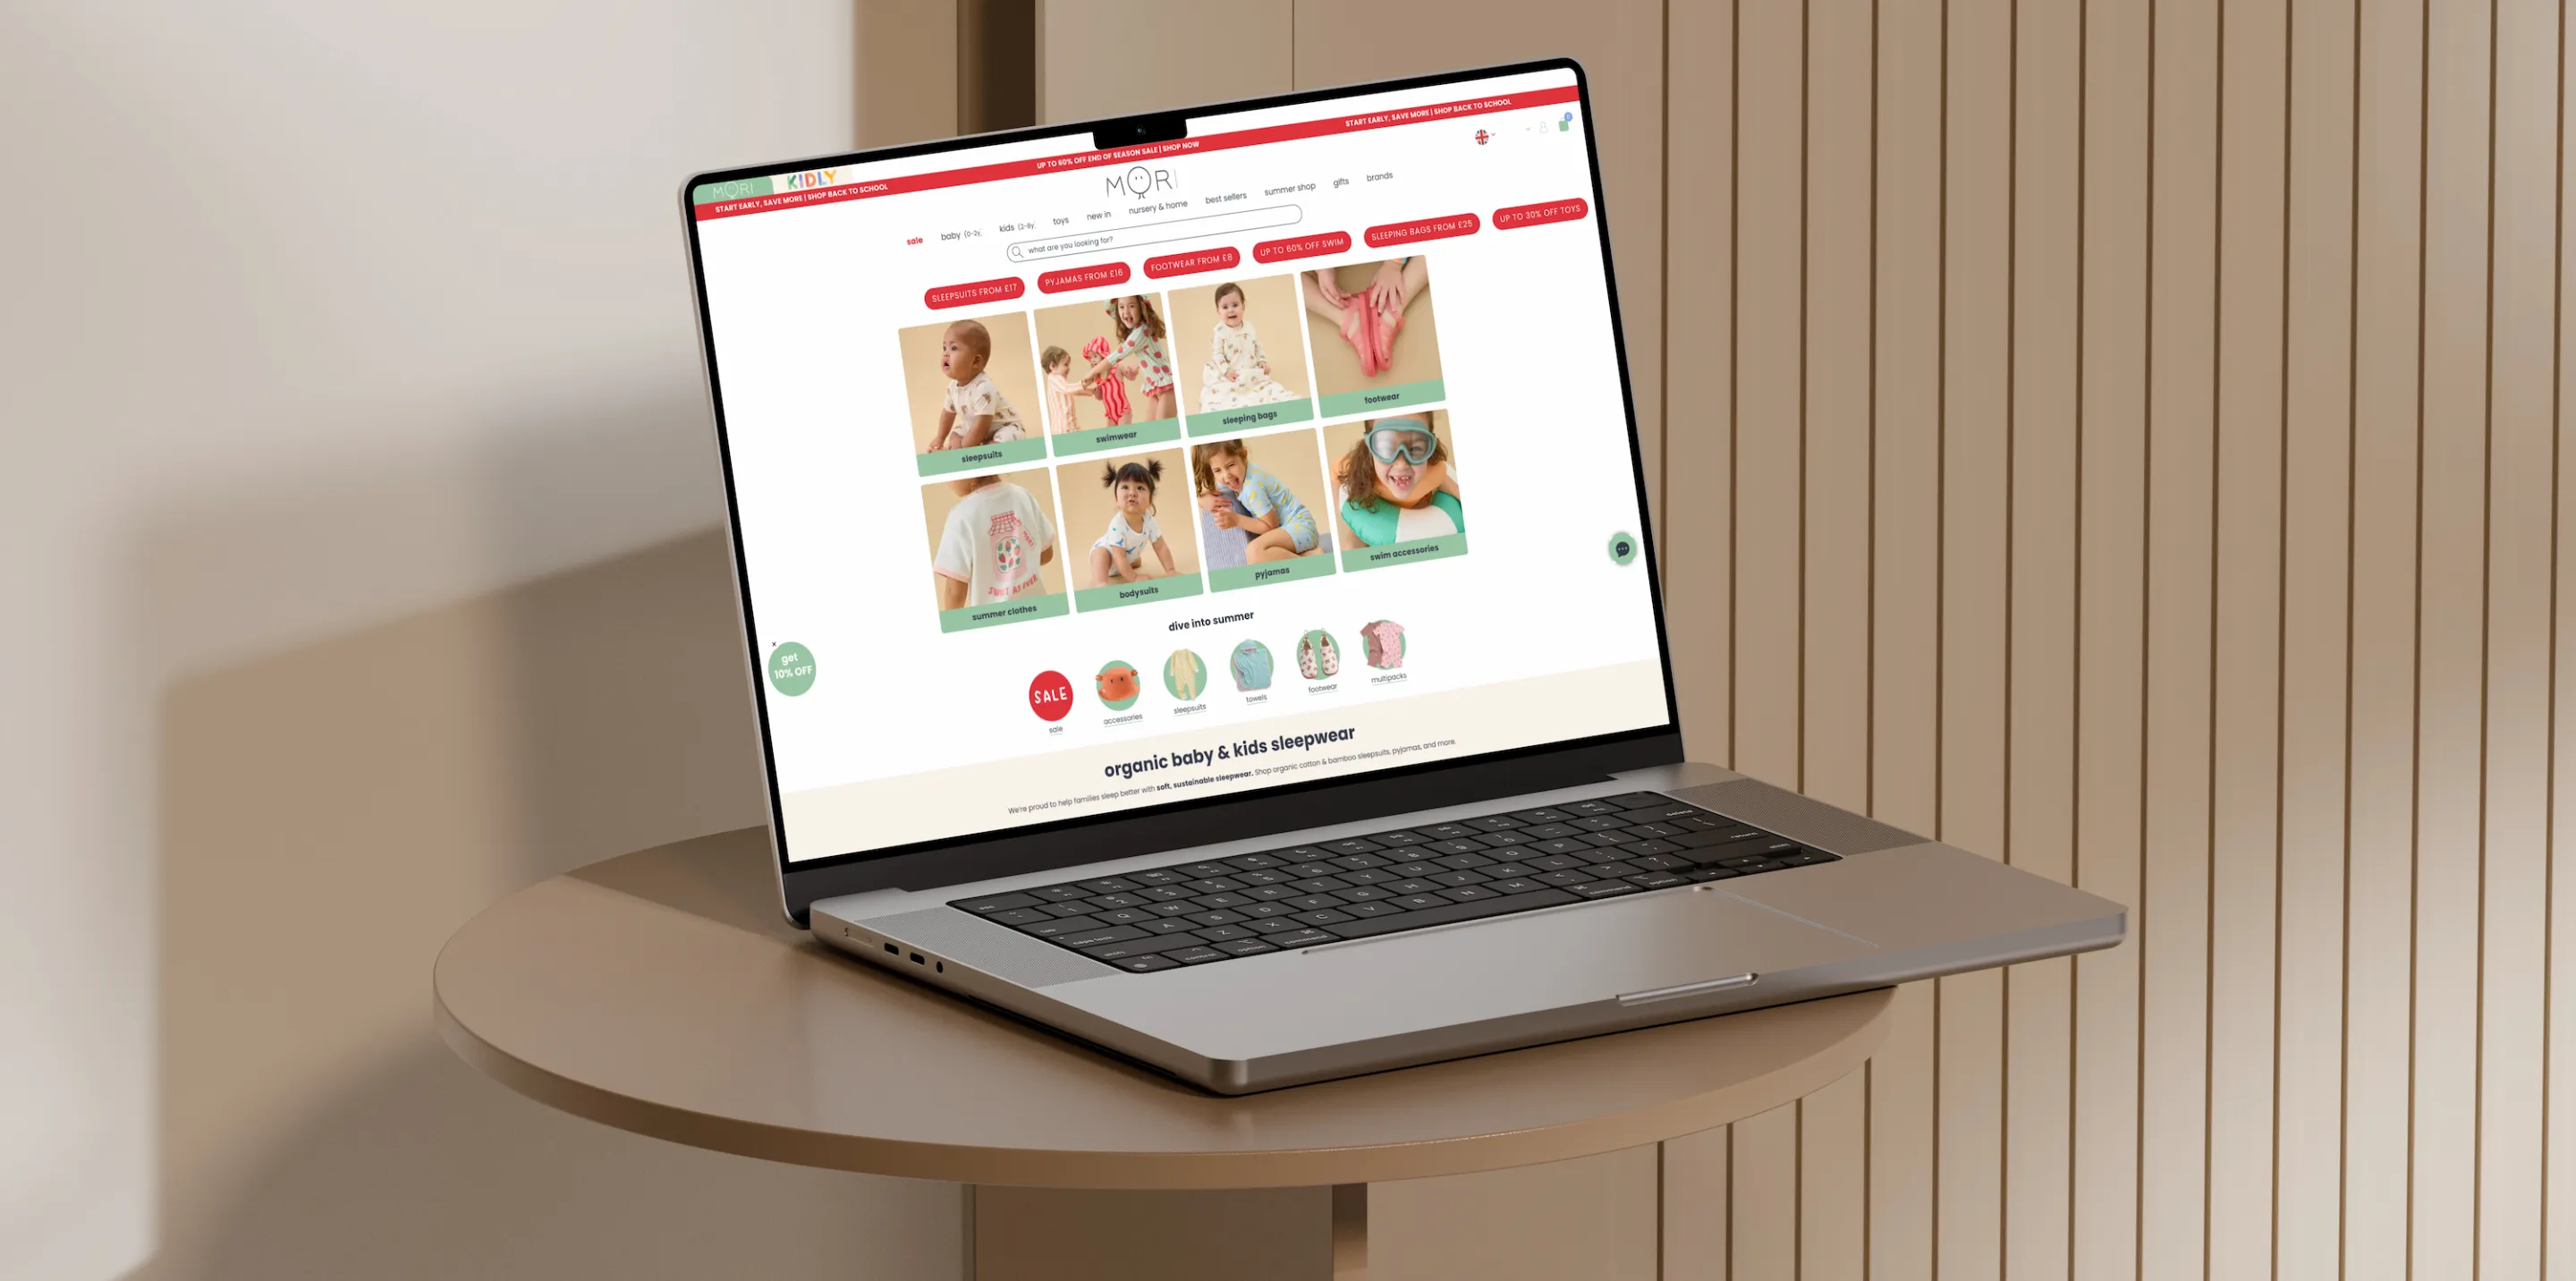
MORI is an award-winning brand on a mission to help families sleep better through sustainable, high-quality babywear. Bitcube has been a partner to MORI almost since the brand's inception — a key pillar of their growth, evolving from a technical service provider into a foundational part of their global operations. We provide a comprehensive team extension, embedding developers and QA engineers directly into MORI's day-to-day workflow, managing everything from daily store maintenance to high-level architectural innovation and migrations as platforms evolve.
Once a month, MORI has to answer one question: how many of each product do we order?
It sounds like a small question. It isn't. MORI sells through three Shopify storefronts, six Amazon marketplaces, retail doors, pop-ups, a marketplace partner and two wholesale accounts, with stock held in third-party warehouses in each region. Ten separate systems, each counting the same units in its own way. Before anyone can decide what to buy, somebody has to make all ten of them agree.
For years, that somebody did it by hand, in Excel. Three workbooks carried the entire process: a UK file of 28 tabs and 110MB, a US file of 14 tabs, and a roll-up where the two markets met and the buy was finally decided. Every cycle opened the same way. Six reports pulled, opened and pasted into the tabs feeding the top sheet. Then a planner read every line in both markets, checking what the forecast produced against what they actually knew about that product. Every line, because there is nothing downstream to catch a mistake: whatever number survives that review is the number that gets ordered and paid for. The review alone took a day per market.
By MORI's own estimate, roughly 95% of each cycle went into assembling the data and 5% into the forecasting decision itself. The expensive part of the job had become the part nobody was hired to do.
The files carried the wear of it. Supplier lead times and order minimums were kept in two places that had to agree with each other. A minimum-stock tab in each market file was wired to nothing at all, so the top-up it was meant to trigger happened by hand, or didn't happen. The proposed order quantity was generated by formula and then typed over, and the original figure vanished the moment it was overwritten. When the two markets were pasted into the roll-up, they went in as flat values, so nothing in the final buy linked back to where any figure came from.
That last part matters more than it looks. A buy gets argued about before it gets placed, and a number nobody can explain is a number nobody can defend.
The obvious response would have been to automate the forecast. It would also have been the wrong one. The forecast was never the bottleneck, and the judgement inside it is the part MORI's merchandisers are actually paid for. Supplier terms, cover targets, the seasonal shape of a category, the eight sanity checks applied before any quantity is accepted: those are decisions, not data, and they belong to the team.
The bottleneck was everything underneath. Ten sources that had never existed in one place, three of which keep no history whatsoever and answer only for the moment you ask them. Two markets forecast separately but meeting in a single purchase order, because a supplier's minimum applies to the combined quantity and neither market can be sized alone. And not one figure anywhere in the process that could be traced back to where it came from.

We didn't build a reorder tool. We built the data foundation underneath it, and the reorder tool was the first thing that foundation had to carry.
That distinction is the whole project. A tool solves the problem in front of you. A foundation solves the next four as well. Every object in this one is defined in a file rather than assembled by hand, so adding a sales channel means adding a connector and a handful of rows, and adding a forecasting method means putting it alongside the ones already there. Nothing about the reorder is welded into the layers beneath it, which is why what came after the reorder arrived so quickly.
Ten sources now arrive automatically, each on its own schedule, before the night's run. Sales for every webstore and retail door. Stock per Shopify location. Six Amazon marketplaces. Both third-party warehouses. The wholesale portal. And the team's own reference workbooks, read live from wherever they already sit.
Two of those channels offer no clean route in. The wholesale supplier portal is a web application built for people, so a browser drives it exactly as a person would. The UK warehouse sends its reports as email attachments, so a mailbox is scanned and every file parsed on arrival. Both would break if the other side changed something, so neither is trusted. Both are checked for freshness, every night.
Getting ten systems to agree turned out to be the real engineering. Amazon will tell you what changed last night quickly, or tell you what happened last year slowly, but never both at once, so the connector runs two readers: one keeping pace nightly, one walking the history backwards in thirty-day passes. One feed reports by its own internal option numbers and never states a product code at all, so its rows resolve on barcodes, then on a crosswalk built from the pairs its own sales prove. Products relaunched under new codes leave their stock and their entire trading history stranded on the old one, so both are brought forward onto the code in use today, and a relaunched line arrives carrying its predecessor's history rather than looking like a brand new product to be bought on nothing. Several systems report the same physical shelf in different terms, so each pool is now counted once, from the system that actually operates it.
Some history had already stopped existing. Three sources answer only for today, Amazon's ledger reaches back about eighteen months, the supplier portal holds thirteen rolling weeks. Each was recovered as far back as it serves, and daily positions were reconstructed where the feeds had never captured them. From here it is captured forward, every night, because there is no second chance at a day nobody recorded.
Everything that survives all of that is reduced to three simple shapes: what sold, what is held, and what is on its way. Each carries the product, the market, the channel and the day. It sounds almost too plain to mention, and it is the entire trick. It means a figure means the same thing wherever it is read, by whoever reads it, and it traces back through every layer to the feed it came from and the day it arrived.
Supplier terms, cover targets, the continuity list, the wholesale plan: none of it was migrated anywhere. It is read live, in the sheets MORI's merchandisers already maintain, and changing any of it needs a merchandiser rather than a developer.
The flow runs one way only. Nothing writes back into those tabs, so a spreadsheet can never overwrite a measured number. The team keep every decision and lose the ability to accidentally corrupt the data, which is the right way round and the opposite of how the old workbooks behaved.
The output lands in Google Sheets, for the same reason. Not a dashboard, not a portal, not a new system to learn. The proposal, the shortfall against both minimums, the cover the order would give, the closing position it leaves behind, each surfaced as a view with the team's own columns beside it. They filter to the market, month or supplier they want, and nobody has to build a report for them.
Every method reads the same twenty-four months of demand and answers for the same nine months ahead, so they can be compared honestly.
Three are genuine candidates. A SKU curve takes a product's own seasonal shape and grows it month by month. A class curve does the same with a category's shape, for a new line with too little history of its own. And TimesFM, Google's forecasting foundation model, is called directly with no model fitted at all.
The other two exist to be beaten. One is simply what the line sold in the same month last year, lifted to this year's level. The other takes the three months before the cycle and holds them flat. Neither will ever be the buy. They are the bar and the control, and any method that cannot beat last year's month or the run rate held flat has not earned the cycle.
We replayed thirteen historical cycles and put every method beside what actually sold. MORI's own arithmetic won. The SKU curve scored best on the lines the buy turns on, and it is the one in use. Every cycle is stamped and kept, so a method is judged on what happened rather than on what it promised, and the choice can change whenever the evidence does.
None of this was worth anything until the team could trust it, and trust in a buying cycle is not granted on a demo.
The foundation stood complete in development three and a half weeks in. Moving it into production went one domain at a time: product, then stock, then sales, then intake, then the month, then the forecast, then the buy. Each was compared against MORI's own August cycle before the next one opened, line by line rather than on totals, because totals hide exactly the errors you need to find. A domain closed only when it landed within five per cent of the buy the team had made by hand. No threshold was loosened to get anything across.
Once every channel's sales, stock and intake sit in one place, that data is worth asking questions of, and most of those questions have nothing to do with the reorder.
So the same foundation carries an AI agent that answers in plain English. Which lines drove last month across the marketplaces. How a day of trade read against the stock behind it. Which sizes are sitting. What a wholesale account took, and when it landed. Questions somebody would otherwise have written SQL for, or waited a week on a report for.
It is grounded in MORI's own vocabulary, with every column described in their words rather than a glossary the model invented. It runs as the person asking, with their access and no more. Asked something the data cannot answer, it says so, rather than answering off the nearest column that looks close enough.
The reorder itself sits deliberately outside it. The buy and the forecast are numbers a purchase order is placed on. Those are computed and checked, never generated.
And nothing ties the foundation to that one agent. MORI point Claude at the same data for their own analysis, and the next thing the team asked for was building their own views the same way. Whatever answers the question reads the same numbers the buy reads.

Production went live on 10 August 2026, twenty-six days after the work started. The manual cycle ran untouched the whole time, because a buying team cannot pause a month while somebody rebuilds their tooling.
It carries 24.9 million rows across ten feeds, going back to March 2015, and it rebuilds every night for around £70 a month.
The assembly is simply done now. Ten feeds land on their own. The forecast runs on its own each month. The proposal arrives on one sheet, already current, and nothing is copied into it by hand from another system. The team open that sheet and start the reorder, which is the job they were hired to do.
MORI worked the September buy on it. They report it runs better than the workbooks it replaced, and the planner running the cycle works from its numbers. Cycle time continues to improve as confidence builds: the line-by-line checking is where the time goes now, and that eases as the numbers keep proving out.
Beyond the reorder, ten years of trading history is finally open to questions asked in plain English, and MORI have started asking their own. Because the forecasting sits alongside the foundation rather than inside it, changing the method rebuilds every model in about half an hour, so which method the buy runs on stays a choice MORI get to keep making.
The reorder was the first thing this foundation had to carry. It was never meant to be the last. More views are already being built on data that is already there, read more often than once a month, with more of the work surrounding the buy brought into the same place rather than left in a file somebody maintains by hand. The goal is a single source of truth, where every question about MORI's trade is answered from one place.
"The value of this project wasn't a dashboard, it was the foundation. Bitcube got our sales and stock data into one central place, which meant we could point AI at it and get useful answers fast instead of waiting on someone to build a report. Our merchandising team is already running their continuity stock forecasting off it and adapting it themselves. Herman and the team were on top of the project throughout, very responsive, quick to fix things and honest when something needed rethinking. The next phase of automations are already in the works, being built on this strong foundation."

Akin Onal
Founder & Managing Director, MORI
NAME
MORI
LOCATION
London, UK (Global)
INDUSTRY
Baby & Children's Apparel
Related Work
An embedded Dev/QA team and a bespoke 'Sleep Club' subscription engine for sustainable babywear.

Eight years building and running a multi-tenant analytics platform — Google Workspace, Microsoft 365 and Slack data, now measuring AI adoption.

An AI scheduling engine that negotiates SEND mediation dates across five participant types — with policy and local authority rules stored as data.

Credit-based booking, billing and trainer payouts for 50+ UK gyms — with 21 health checks that surface billing drift before a member does.
Let's talk about your goals and find the best path forward together.
Start a conversation